|
 |
|
Question : How do I combine Excel data in my Reports ?
Data in Excel Spreadsheets is structured in tabular format which corresponds exactly to the way in which data is stored
in relational database.
Also Spreadsheets are commonly used and the data frequently needs to be integrated with other data within an organization.
Therefore we would expect to find a wide range of solutions are available to solve this problem.
Here is a small sample :-
� An ODBC connection can be established for a spreadsheet.
� Informatica allows Spreadsheets to be defined as a Data Source.
� Microsoft�s SQL Server Integrated Services provides for Excel to be defined as a Data Source.
� Oracle provides a facility to define EXTERNAL table which can be Spreadsheets.
� Salesforce.com provides their Excel Communicator.
Question : Does your Chief Exec have Report requirements that you cannot meet ?
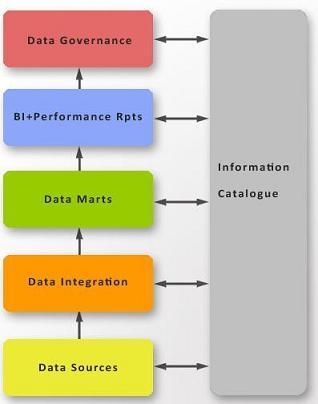
In order to respond to this situation appropriately, it is necessary to have an Information Catalogue,
a Data Architecture and Data Lineage.
The solution then involves the following Steps :-
Step 1) Produce a draft Report for the Chief Execs approval
Step 2) Trace the lineage and perform a �gap analysis� for all new data items.
Step 3) Talk to the Data Owners and establish when and how the data can be made available.
Step 4) Produce a Plan and timescale
Step 5) Review your Plan with the Chief Exec and obtain this agreement and formal sign-off.
Step 6) Deliver !!!
Question : What is Best Practice ?
Performance Reports take data from Data Marts and many of the same considerations apply when it comes to
determining Best Practice.
One difference is that is necessary to have a clearer understanding of the business operations and how the right kind of
Performance Reports can provide insight to the business users.
This leads to the need for a management education process to be in place so that the evolution of Performance Reports can
be planned in a logical manner, from basic summaries, to KPIs, Dashboards and so on.
Question : How do I produce Integrated Performance Reports for senior management ?
The key action here is to establish a unified Reporting Data Platform.
This will involve aspects previously discussed, including MDM, CMI and will certainly involve Data Lineage.
Senior Management will want to take a view of the integrated data and not focus on details of derivation.
Therefore, we have to follow the MDM approach with Data Lineage for each item in the Integrated Performance Reports.
Key Performance Indicators (�KPIs�)
Question : What are Key Performance Indicators (�KPIs�)
Key Performance Indicators (�KPIs�) are in common use and represent one aspect of Best Practice.
A variation of this approach are Key Quality Indicators,(�KQIs�) which are used to monitor and manage Data Quality.
Dashboards and Scorecards are often used in association with KPIs.
Click to go back.
|
|