| |
 |
| |
 |
|
|
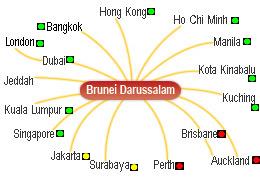
DEMONSTRATION OF RED-AMBER-GREEN REPORTING :

This shows a map of cities served by Royal Brunei Airlines in South-East Asia, Australia and New Zealand.


A single traffic-light colour is placed close to each City.
The colour is Red if something is seriously wrong, Amber (or Yellow) if slightly wrong, and
Green if everything is OK.


The colours displayed are a demonstration of a Performance Reporting System for a fictitious
Freight Transport operation in South-East Asia.
|
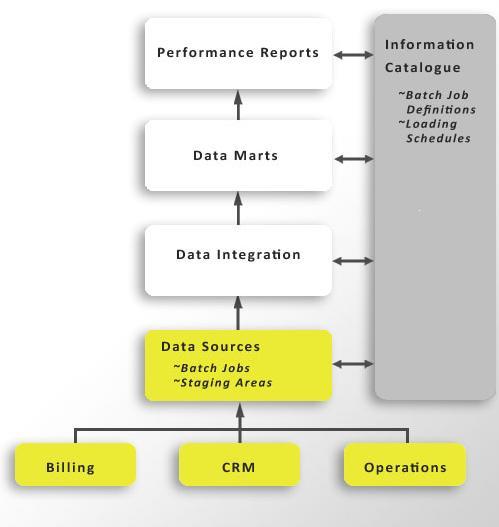
1) INTRODUCTION :
This is a Tutorial on Integrated Performance Reporting based on the Database Answers
Road Map for Enterprise Data Management.
Here's a related
Tutorial on MDM and CRM which provides the next step in detailed Specifications for mapping to a
commercial product such as Informatica (Sections 18 and 22).
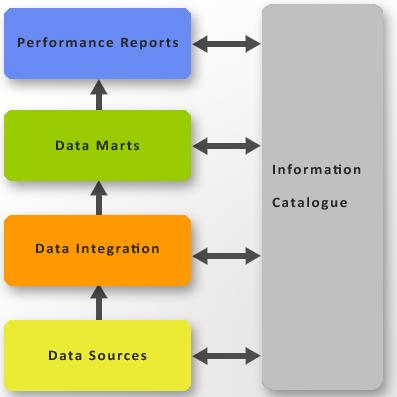
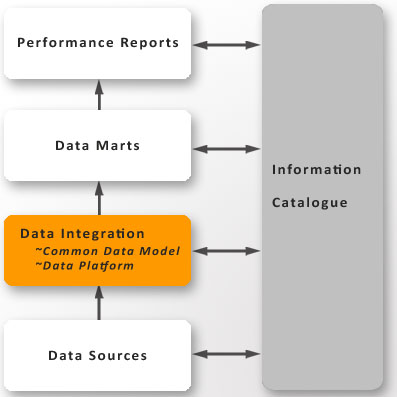
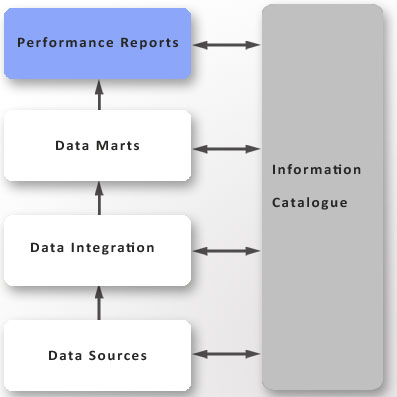
The Scope includes these five major Components :-
1) Performance Reports
2) Data Marts
3) Data Integration
4) Data Sources
5) An Informtaion Catalogue
Data Integration provides a "Single View of the Truth"
Each Components has implications for Data Quality.
The Tutorial concludes with an analysis of how commercial products from
Informatica and Microsoft can be used to implement this Approach.
I hope you find this Tutorial interesting and helpful.
Please email me and let me know.
|
|
|
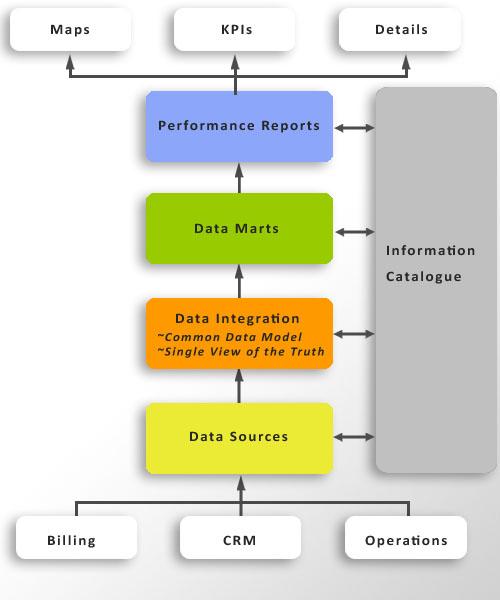
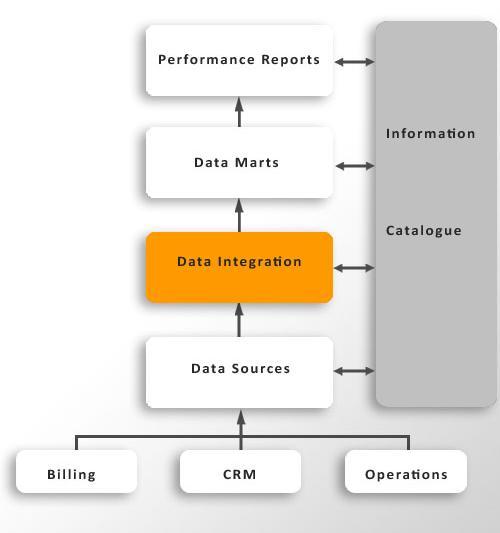
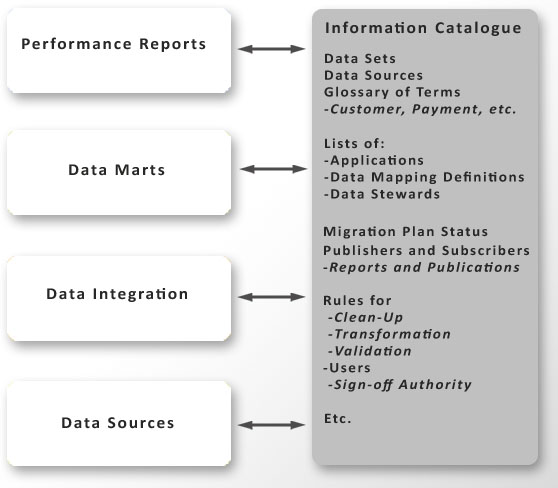
2) MORE DETAILS
This diagram shows some more details.

For example, two important topics in Data Integration are a
Common Data Model and a 'Single View of the Truth'.

Examples of Performance Indicators include Basel II and Sarbanes-Oxley.
|
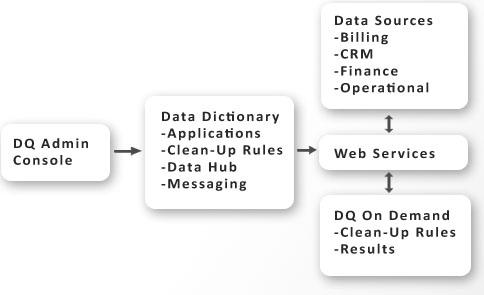
3) FUTURE ARCHITECTURE FOR DATA QUALITY :

This Architecture shows how Data Quality will be achieved in the future.

It is based on the role of a Data Quality Administrator.

In the future, Web Services will be used to run Data Quality procedures
against data that can be stored in a variety of locations.
Results of Data Quality Test Runs will be reported locally to the Administrator.

This approach has many benefits :-
It is possible to establish DQ functions which can be located anywhere,
either internal or external to the enterprise.
Reference Data can be centralised in the Global HQ and accessed from
anywhere around the world.
|
|
|
4) DATA SOURCES :
Data Sources are the point-of-entry for data from any Source.
These can include batch inputs, such as Spreadsheets, data
extract files from Operational Systems, and third-party data.
They can also include real-time input such as PDA or Smartphone data,
data delivered by Web Services, or Internet Forms.
|
5) DATA INTEGRATION :


Scope of Integration

Data Integration includes :-
Mapping to Common Data Model
Transformation
Clean-Up
Validation


The details of all Data Transformation are defined in
terms of Data Structures, Interfaces, and Data Models.
All Transformations also require Rules, with different syntax
for different types of Transformations.
When Transformations are applied, everything becomes a transition from
one Model to another
|
|
|
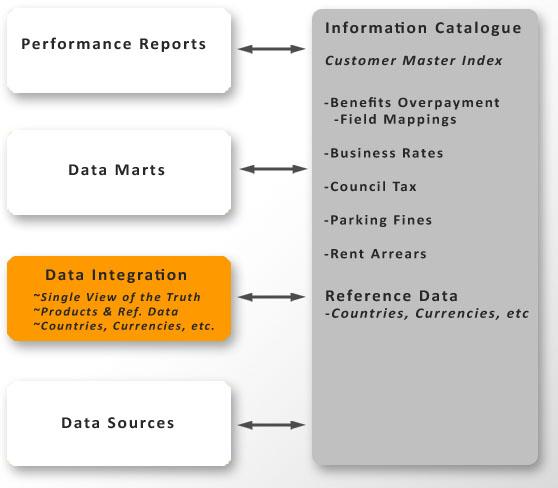
6) A SINGLE VIEW OF THE TRUTH :
A Single View of the Customer is enabled by a Customer Master Index
is used to consolidate data about a Customer from different Sources.
This involves matching individual Customers and mapping all Data Sources
on to a common definition of a Customer.

This requires good quality data so that data integration is guaranteed
to produce valid results.

This is achieved by applying Transformation algorithms to the individual
data fields from the Operation Applications.

Definitions of these Transformations are stored in the Information Catalogue,
along with Business Users who have authority to sign-off acceptable Data Quality.
|
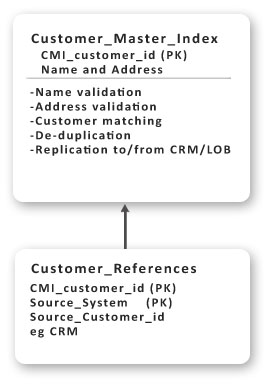
7) A CUSTOMER MASTER INDEX :
	A Customer Master Index is used to consolidate data about a Customer
	from different Sources.
	This diagram shows the Customer Master Index (CMI) and the processes
	that are associated with it.
|
|
|
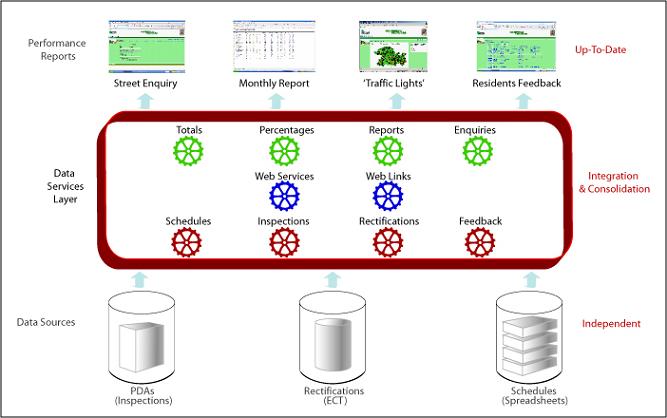
8) SOA ARCHITECTURE :
	In this diagram Levels 2 and 3 in the DQ Architecture are
	combined into one Data Services Layer.
	Data Validation is applied when data is loaded in batch mode at
	regular intervals, such as monthly. Validation is also applied in
	real-time when data is loaded using PDAs or Smartphones.
|
9) COMMON DATA MODEL :
	This Common Data Model applies to a wide range of business operations and environments.
	It provides a standard Layer which provides a target for integration of data from
	various Sources, which are existing Operational Systems.
|
|
|
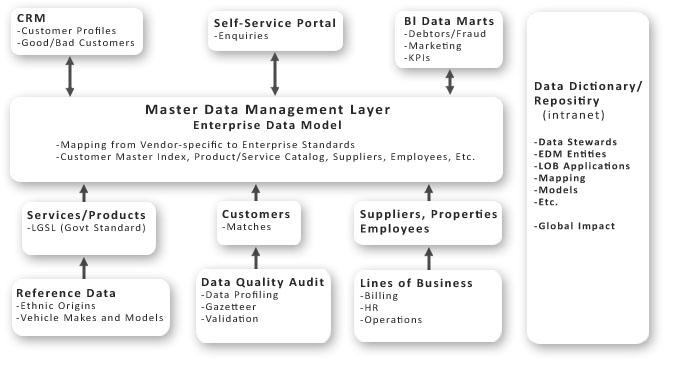
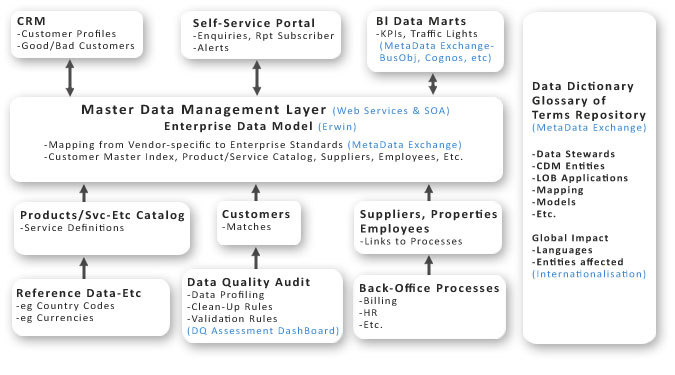
10) MDM ARCHITECTURE :
	This diagram shows an expanded version of the Data Integration Layer.

	The Enterprise Data Model is also called the Common Data Model.
|
11) DATA INTEGRATION :
Data Integration includes applying Rules for :-
1. Transformation
2. Clean-Up
3. Validation
The final step is mapping to the Common Data Model.
The use of Rules and a Rules Engine is a very powerful
technique to implement these processes.
Some examples of Rules are shown in the Section on the
Information Catalogue.
Rules fall into a number of categories:
- Field Validation - these perform the basic data manipulation
required to understand data, for example, checking that an e-mail has
the right format, or checking for typing errors in fields, etc.
- Cross-Reference - these check two or more fields with each other,
for example, that an age field is consistent with a data of birth field,
or a first name matches the gender of a title, etc.
- Reference Data - these rules match to internal or external reference files,
for example, Royal Mail's PAF File, ( Postal Address File).
- Deduplication Rules - these apply particularly to Customers, but are also
relevant for matching and deduplication 'de-duping' functions across multiple data sources,
for example, deduplicating Customers across Billing, CRM and Operational Systems.
The details of all Data Transformations are defined in terms of Data Structures,
Interfaces, and Data Models.
All Transformations also require Rules, with different syntax for different types of
Transformations.
When Transformations are applied, everything becomes a transition from one Model to another.
|

|
|
12) DATA PLATFORM :
	The Data coming out of the Data Platform must be of good quality to provide a sound
	foundation for the overall Data Marts.
	The Common Data Model is a vital Component in the Data Platform because it provides a
        technique for consolidating multiple Sources into one.
|
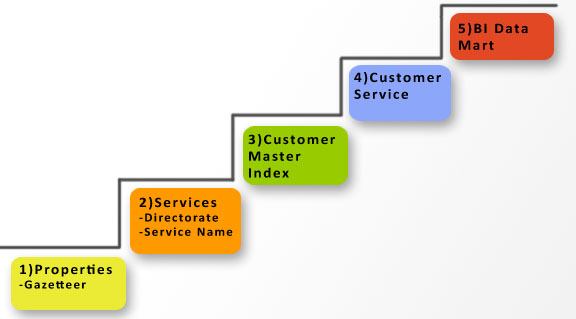
13) STEPS IN BUILDING THE DATA PLATFORM :
Data at each level, from the bottom to the top, builds on the lower one.
The lowest ones here are Reference Data, which in this case, are Properties and Services.
Then the Customer Master Index, which part of an MDM approach.
Finally, Customer Services and a Data Mart.
The Steps in establishing good quality data at each Step :-
- Define the Rules for checking and improving Data Quality for each Data Set.
- Apply the Rules until a satisfactory result is achieved.
- Move on to data at the next Step.
|
|
|
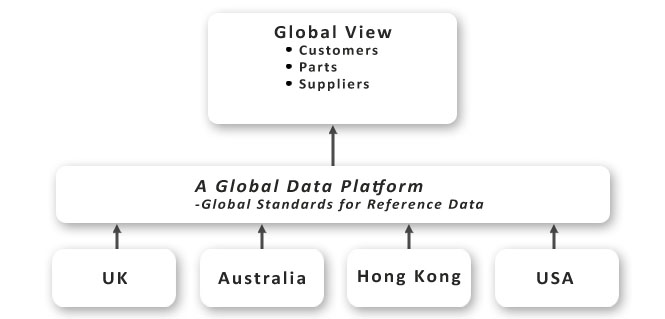
14) GLOBAL DATA PLATFORM :
	This diagram can be used to plan an Approach to a Global Data Platform.
	It provides a focal point for design and implementation of a
	common approach to the consolidation of data.
|
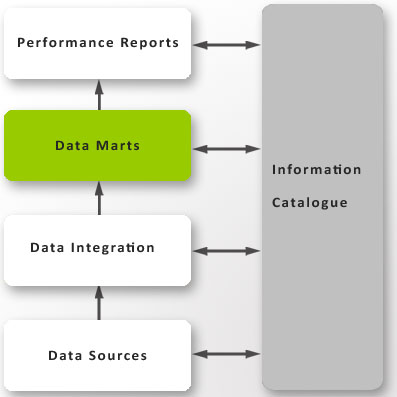
15) DATA MARTS :
	The data produced by the Data Integration Layer should be
	consistent and of a very high quality, especially where the
	matching join fields are required.
	These conditions are required for the data to be loaded into
	Data Marts with compatible Dimensions and Facts.
	This should be straightforward if the Data Integration Layer
	has been designed correctly.
	However, it is possible that new Data Marts may be required
	that may, in turn, require new combinations of data that will show up
	incompatible or incorrect data.
	In this case, additional Validation Rules will need to be defined,
	signed-off and recorded in the Information Catalogue.
|
|
|
16) DATA MODEL FOR DATA MART :
This is a Model for a typical Data Mart for Customers,
Products and Purchases.
It is necessary to have good quality Data in order for
it to be loaded into the Data Mart.
In other words, it is necessary to have a Single View of the Truth.
This includes successful completion of these activities :-
- Mapping Customer and Product data to a single definition
in the Common Data Model
- Conversion of units to a standard Unit of Measurement
- Calculation of the Fact which are Amounts and Counts in line with the
Key Performance Indicators (KPIs).
The Data Model shown on the left is a generic design that can be used to
define a Template for Data Marts.
|
17) PERFORMANCE REPORTS :
Overview
In recent years there has been increasing attention to the
need for enterprises to report correct data in a wide range of
Performance Reports.
This applies to Basel II in the financial world, and Sarbanes-Oxley
in the business world.
A failure to comply with the appropriate regulations can result in a
prison sentence for the senior management responsible.
This has meant that attention has been focussed on the critical aspect
of Data Quality.
Metrics for Data Quality
These are 'Key Quality Indicators' (KQIs) similar to 'Key Performance Indicators' (KPIs).
Defining metrics for data quality makes it possible to measure the quality
and establish a plan to improve it.
Every time a rule is executed, the improvements can be measured and targeted.
This could be done on a daily or weekly, and graphs could be plotted to keep
track of how well the data quality has improved.
Let's say you want to measure the quality of your account records.
The first step is to establish the Metrics.
Step 1) in establishing Customer Data Quality as as a Metric and part of a
'Single View of a Customer' means addressing these Questions :-
- Are business names matched to an external source, such as Experian's National
Business Database ?
- Is the address valid and in the UK Royal Mail Postal Address File (PAF) ?
- Does a valid e-mail exist ?
- A correctly formatted telephone exists,
Is the Customer record is unique ?
Step 2) is to assign a weighting to each Metric - for example, 80%, 20%,
15%, 5% and 5% of the respective rules.
This is averaged to create a unique value that indicates the level of Customer
Data Quality.
The value of subsequent data improvement would re-calculate these values and
provide historical set of metric data that truly shows the improvement in data quality.
|
|
|
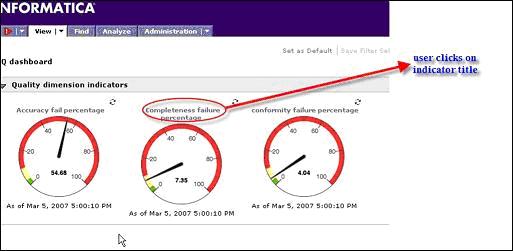
18) EXAMPLE OF A DQ DASHBOARD :
	Key Performance Indicators ('KPIs') would be defined as
	metrics for Data Quality.
	This screenshot shows an example of a Dashboard produced by Informatica,
	which is a major supplier of Data Integration software.

This diagram shows a Dashboard with KQIs which are Failure Percentages for
Accuracy, Completeness and Conformity of Data.
|
19) THE INFORMATION CATALOG :
	Overview

The Catalogue is typically published over the Intranet and
	stores descriptive information about the five major Components and
	their relationships.

	Globalisation
	Data Quality on a Global scale requires that data is stored in
	a manner that is compatible with the character sets in all the
	appropriate languages.
	The best solution to this is to use Unicode to hold character
	information so that European and international languages are supported.
|
|
|
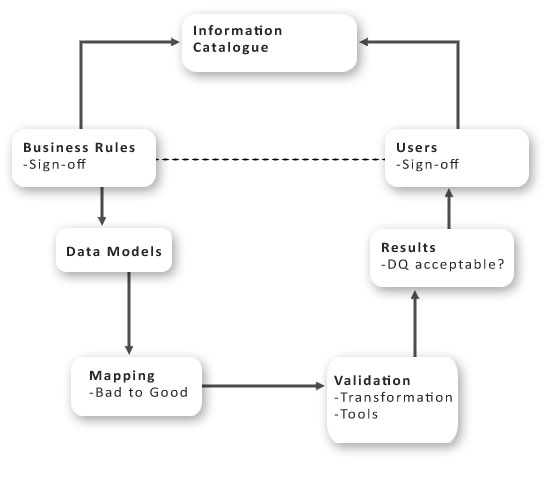
20) THE ROLE OF THE INFORMATION CATALOG :
	Overview
	This diagram shows the Role that the Information Catalogue plays in planning
	and controlling the Steps involved in measuring and improving Data Quality.
|
21) EXAMPLE OF THE INFORMATION CATALOG :
	This example shows how details of Data Models would be
	recorded in an Information Catalog.
|
|
Category
|
Data Model Name
|
Description
|
|
Corporate
|
Corporate
Data Model
|
Contains
Customers, Services, Property and
Finance.
|
|
|
|
|
|
Subject
Area
|
Contracts
|
Applies
to Council Tax Payments, Rent Arrears Repayment Schedule, etc..
|
|
Subject
Area
|
Customer
|
Shows
Person as Super-Type, & Customers, Youth Offenders, etc. as Sub-Types
|
|
Subject
Area
|
Data
Warehouse - Debtors
|
Useful
for the Debtors Pilot Project.
|
|
Subject
Area
|
Data
Warehouse - Service Usage
|
To be determined
|
|
Subject
Area
|
Finance
|
Shows
Accounts and Transactions.
|
|
Subject
Area
|
Maintenance
|
Applies
to Housing Repairs, Grass-cutting, Street Lights,Vehicle Maintenance.
|
|
Subject
Area
|
Parties,
Organisation and People
|
Shows
Party as Super-Type, with Organisations & People as Sub-Types.
|
|
Subject
Area
|
Property
|
Shows
Property as Super-Type, with Hostels, Parks, etc. as Sub-Types.
|
|
Subject
Area
|
Reference
Data
|
Shows
Reference data from all Application Data Models
|
|
Subject
Area
|
Services
|
Also
called a 'Generalised Customer Data Model (GCDM)'
|
|
Subject
Area
|
Single
Sign-On
|
Shows
cross-references from Customer ID to other Applications
|
|
|
|
|
|
User
View
|
Customer
Problems and Haringey Solutions
|
Simple
but powerful Introductory Model.
|
|
User
View
|
Customers
and Addresses
|
To be determined
|
|
User
View
|
Customers
and Events
|
To be determined
|
|
|
22) IMPLEMENTATION OF MDM WITH INFORMATICA :
	Overview
	This diagram shows in blue the Informatica Components
	that would be used to implement the Generic Architecture.
|
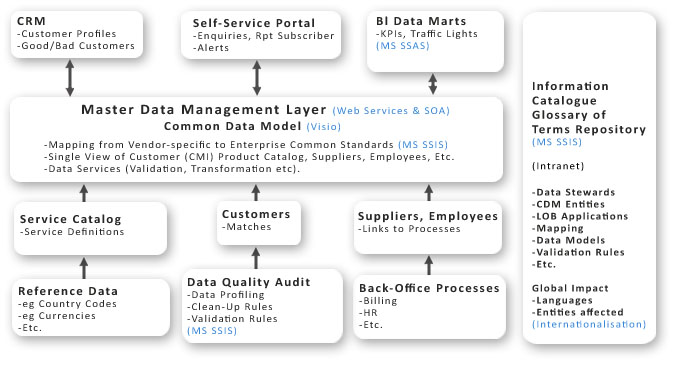
23) IMPLEMENTATION OF MDM WITH MICROSOFT :
	Overview
	This diagram show how Microsoft SQL Products, specifically Server
	Analytical Services (SSAS) and Integration Services (SSIS) could
	be used to implement the Architecture.
|
|
|
|
24) SCOPE OF THIS TUTORIAL :
During this short Tutorial,we have covered the following Topics :-
- Master Data Management
- Performance Reports
- Data Marts
- Data Integration
- Data Source
- Information Catalogue
If you would like to see other Topics included, please let me know.
|
25) PLEASE EMAIL ME
I hope you have found this Tutorial interesting and useful.
Please
email me with your questions or suggestions so I can improve this first draft Tutorial.
I look forward to hearing from you !
Barry Williams
Principal Consultant
Database Answers Ltd.
London, England
January 1st, 2017
|
|
|
|